How to Master Instagram Insights: The Complete 2026 Analytics Guide
TL;DR
Instagram Insights turns your posts, Reels, and Stories into a clear picture of what actually works — so you can stop guessing and start growing on purpose. This guide walks you through switching to a professional account, reading every metric that matters (including the big Views change that reshaped Instagram analytics in 2025), avoiding the vanity-metric traps, and turning raw numbers into a repeatable content strategy. Whether you’re a solo creator or running a brand account, this is the reference you’ll come back to every time you open your dashboard.
Key Takeaways
- You need a Business or Creator account to see Insights — personal accounts don’t get analytics, and the clock on your data only starts once you switch.
- Since April 2025, “Views” is Instagram’s primary metric, replacing Impressions and Reel Plays across every format. If your strategy still centers on impressions, it’s out of date.
- The metrics that actually predict growth are views, reach, accounts engaged, saves, and shares (sends) — not likes.
- Instagram keeps only 90 days of data (and Story metrics for just 14 days), so exporting monthly is the difference between having a trend and losing it.
- The real value isn’t in checking numbers — it’s in acting on them: posting at peak times, doubling down on high-share formats, and cutting what your audience skips.
What are Instagram Insights?
Instagram Insights is the analytics toolkit built directly into the app for Business and Creator accounts. It takes everything you do — every post, Story, Reel, and Live — and translates it into data about who your audience is, what they respond to, and when they’re paying attention.
For anyone trying to grow, that shift from “I think this is working” to “I can see exactly what’s working” is the whole game. Insights replaces opinion with evidence: which formats earn saves, which topics get shared into DMs, what time your followers are actually online, and how your audience is changing month to month.
You don’t need to be a data analyst to use it. You just need to know what each number means and which ones deserve your attention — which is exactly what the rest of this guide covers.
The 2025 shift you can’t ignore: Views replaced Impressions
Before we go further, one update reframes everything. On April 21, 2025, Instagram made “Views” its primary metric across all content types — posts, Reels, Stories, and profiles — retiring “Impressions” and “Plays” in the process.
Here’s why it matters:
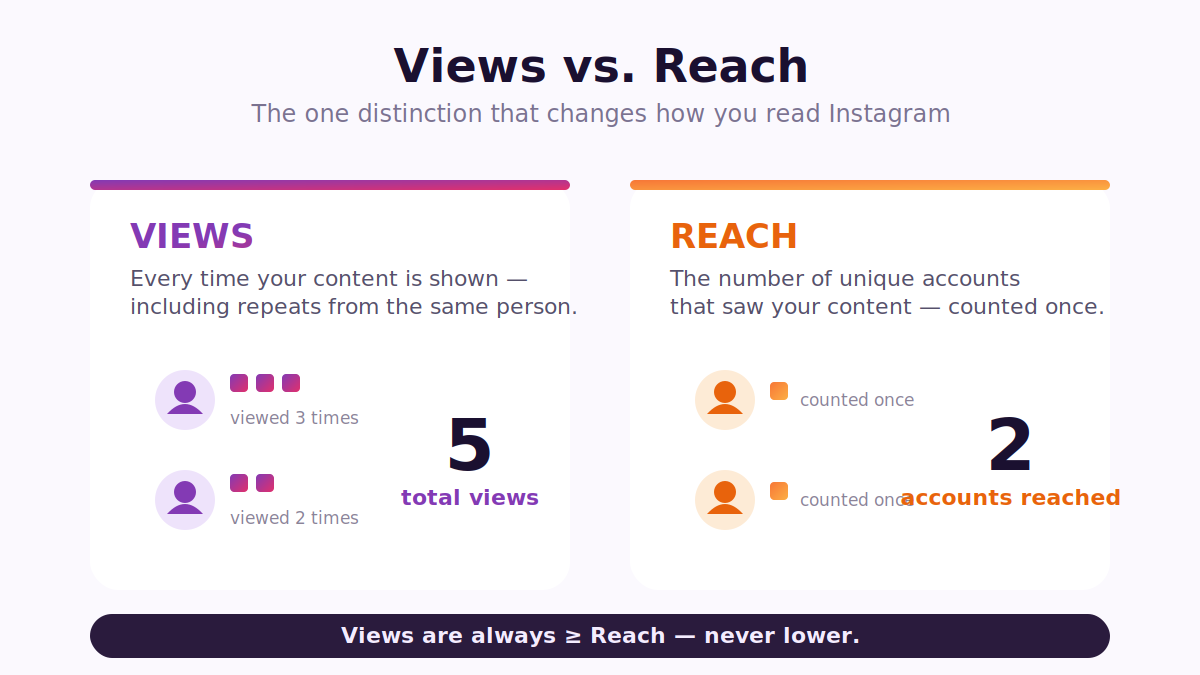
- Views counts every time your content is shown, including repeat views from the same person. It’s now the headline number on almost every piece of content.
- Reach counts unique accounts that saw your content. Because reach only counts people once, views will always be equal to or higher than reach — never lower.
Instagram’s head, Adam Mosseri, has said the metrics creators should focus on now are views, reach, and sends, and specifically pointed to sends per reach as the clearest signal of whether content is genuinely resonating. In other words, the platform has moved away from raw visibility toward how far your content travels between real people.
One practical warning: if you compare numbers from before and after April 2025, they won’t line up cleanly — the counting method changed. For accurate trends, keep your comparison windows entirely within the post-April-2025 period.
How to access and set up Instagram Insights
Step 1: Switch to a Business or Creator account
Insights only exist on professional accounts. Converting takes under a minute:
- Open your profile and tap the menu (☰) in the top right.
- Go to Settings and privacy → Account type and tools.
- Tap Switch to professional account.
- Choose Creator (best for individuals, public figures, and content creators) or Business (best for companies, stores, and brands with a team).
- Pick a category and finish the prompts.
Creator vs Business, quickly: the analytics are nearly identical, so don’t overthink it. Choose Creator if the account is tied to a personal voice; choose Business if it represents a company or needs shopping and contact features. The far more common mistake isn’t picking the “wrong” one — it’s not switching at all, or switching late and expecting old data to appear. It won’t. Your data tracking starts the day you convert.
Step 2: Find your data
Once you’re professional, you have three ways in:
- Professional Dashboard — tap it right under your bio on mobile (or find it in the left sidebar on desktop). This is your command center, showing top-line performance for the last 30 days by default.
- Insights tab — from the ☰ menu, for a fuller breakdown.
- Per-post Insights — tap View Insights directly on any individual post or Reel for that piece’s numbers.
If you don’t see any of these, your account is still personal — that’s the number-one reason Insights “disappears.”
Reading the dashboard: the three tabs
Instagram redesigned Insights into three dedicated tabs instead of one long scrolling page. Here’s what lives where:
Overview — your top-line snapshot: views, accounts reached, accounts engaged, and total followers. You can adjust the date range (7, 14, 30, or 90 days) to spot trends or zoom in on a campaign.
Engagement — how people interacted: interactions, accounts engaged, and increasingly prominent quality signals like share rate and skip rate. This is where you learn not just if people engaged, but how deeply.
Audience — who your followers are: follower growth (gained vs lost), top locations, age range, gender split, and — the most actionable of all — most active times by day and hour.
Every metric that matters, explained
This is the reference section. Bookmark it.
| Metric | What it means | Why it matters |
|---|---|---|
| Views | Total times your content was seen, repeats included | The primary performance number since 2025 — your headline visibility |
| Reach | Unique accounts that saw your content | Tells you your true audience size; pair with views to see repeat viewing |
| Accounts engaged | Unique accounts that interacted | Prevents a few superfans from inflating your engagement picture |
| Interactions | Total likes, comments, saves, shares | Raw measure of active response |
| Saves | People who bookmarked your post | A strong signal your content is genuinely useful — people plan to return |
| Shares / Sends | Times your content was sent to others | The strongest endorsement — Instagram now weights sends heavily in distribution |
| Share rate | Shares relative to reach/views | Reveals what content is “portable” enough to spread person-to-person |
| Skip rate | How often people swipe past | A quiet warning sign that a hook or format isn’t landing |
| Completion rate | % who watched a Reel/Story to the end | Core to how far Instagram pushes your video |
| Profile activity | Profile visits, follows, link/button taps | Connects content to real actions further down the funnel |
| Follower growth | New followers vs unfollows over time | Your momentum gauge — the curve matters more than the total |
If you want to go deeper on which of these to prioritize for a brand account, our guide on Instagram metrics beyond likes breaks down the ones worth building a strategy around.
Post, Reel, Story, and Live insights — what’s different
Not every format reports the same way:
- Posts and carousels: tap View Insights for views, reach, saves, shares, comments, and profile activity. Carousels also show how far people swiped — a useful read on whether your hook held.
- Reels: your discovery engine. Beyond views, watch the follower vs non-follower split (high non-follower reach means the algorithm is pushing you to new people), plus completion rate and skip rate.
- Stories: track taps forward/back, exits, replies, and link clicks. Important: Story metrics vanish after 14 days, so capture anything you want to keep.
- Lives: see peak concurrent viewers and total participation to judge whether live formats are worth your time.
Reviewing these side by side tells you which format earns which kind of attention — saves on carousels, sends on Reels, replies on Stories — so you can match format to goal. For more on choosing formats deliberately, see our breakdown of Instagram content pillars with creator examples.
Don’t get fooled by vanity metrics
It’s easy to chase big, satisfying numbers. But likes and raw view counts often flatter you without telling you anything useful. Prioritize the metrics that signal real value:
- Saves — people found it worth keeping.
- Shares / sends — people found it worth passing on. In 2026, Instagram’s algorithm weights sends above likes, comments, and saves for distribution, which makes this the metric to obsess over.
- Sends per reach — Mosseri’s recommended health check: of everyone who saw it, how many cared enough to share it?
- Conversions — for brands, the profile visits, link taps, and shop actions that connect content to outcomes.
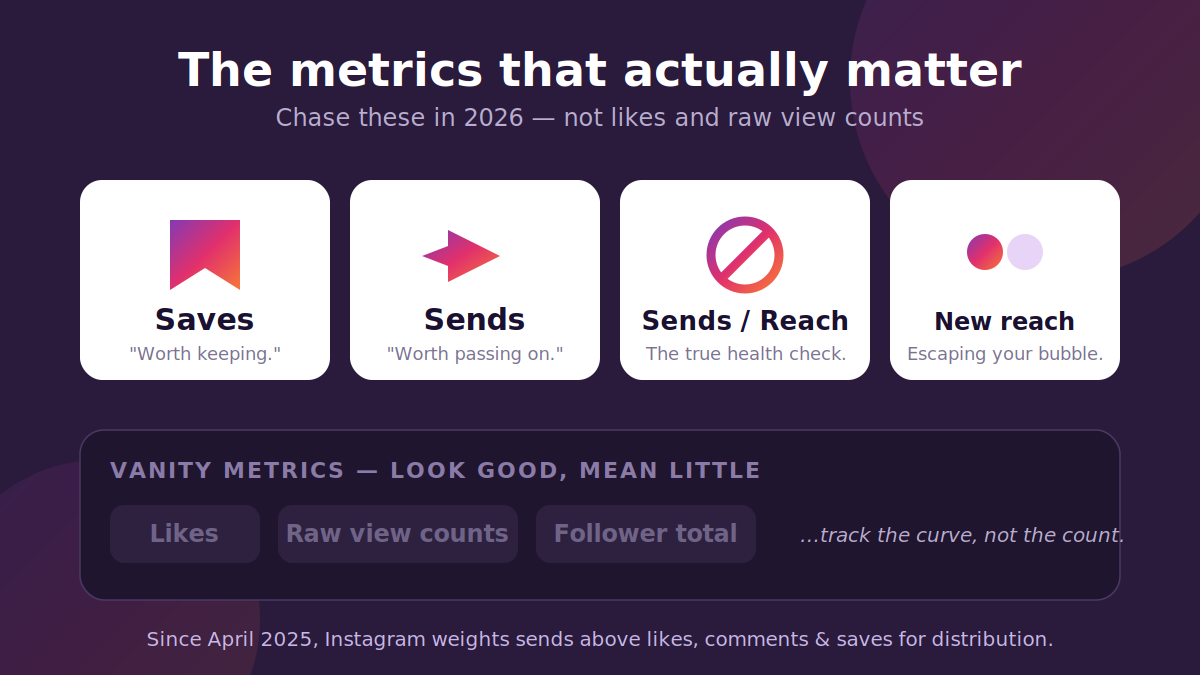
A quick reframe: if reach rises but views don’t, people saw you but didn’t stick. If non-follower reach is low, your content isn’t shareable enough to escape your existing audience. Reading these relationships — not single numbers — is where strategy lives.
Competitive Insights: benchmark without leaving the app
A newer addition worth knowing: Instagram rolled out Competitive Insights inside the Professional Dashboard, letting you compare your account against up to 10 competitors on follower growth, posting frequency, and content mix over 30, 60, or 90 days.
Two caveats: it now generally requires a Meta Verified subscription, and it won’t show per-post engagement rates — so treat it as a quick directional check, not deep analysis. For a proper competitive breakdown, pair it with dedicated competitor content analysis tools.
Limitations and data traps to watch
Even a great toolkit has blind spots. Know these before you draw conclusions:
- 90-day memory. Instagram only retains analytics for 90 days (Stories, just 14). Export or screenshot key numbers monthly, or you’ll lose your history for quarter-over-quarter comparisons.
- A 24-hour refresh lag. Data updates roughly once a day, so give a new post time before judging a spike or dip.
- No native raw export. For deeper analysis or long-term tracking, you’ll need Meta Business Suite or a third-party tool.
- No revenue attribution. Insights shows engagement, not sales. Add UTM parameters to your link-in-bio and track conversions in Google Analytics or your e-commerce platform.
- Pre/post-April-2025 gaps. As noted, older impressions and newer views aren’t directly comparable — keep comparison windows on one side of that line.
Quick fixes when numbers look off: confirm your account type, cross-check against a third-party dashboard, and filter out spam spikes or outliers by adjusting your date and content-type filters. Regular data hygiene keeps what you see honest.
Turning analytics into a growth strategy
Data is useless until it changes what you do. Here’s how to close that loop.
Post when your audience is actually online
Open Audience → most active times. Instagram shows you, by day and hour, when your followers are on the app. Schedule your most important content — your “hero” Reels and carousels — to land just before those peak windows so you catch the wave as it builds. You can automate this with Instagram’s native scheduler or a dedicated planner so timing stops being a source of stress. (We compare options in our roundup of the best social media planners.)
Double down on what spreads, cut what gets skipped
Review which formats earn the most saves and sends, and make more of them. Just as importantly, watch skip rate — if a format is consistently swiped past, that’s your audience telling you to stop making it. Look for patterns: maybe product demos spike during launches and behind-the-scenes Stories peak on weekends.
Personalize to who’s actually following you
Use demographic data to shape your language, visuals, and timing. If your Audience tab shows mostly students in Tehran who are most active after 9 PM, write and schedule for them, not a generic “everyone.” And when your reach expands into new cities or countries, run small content experiments to see what lands in each region.
Refine hashtags and campaigns continuously
Track which tags actually bring in new reach, drop the dead weight, and rotate in fresh, relevant ones. During launches or events, watch your campaign hashtags closely so you can adjust tactics while they still matter.
For a full framework that connects these habits to measurable goals, see our guide on building an Instagram growth strategy.
Native app vs Meta Business Suite vs third-party tools
Match the tool to your needs:
| Tool | Best for | Trade-off |
|---|---|---|
| Instagram app | Fast, everyday checks on the go | 90-day limit, no raw export |
| Meta Business Suite | Managing Instagram + Facebook together, custom reports | Still bound by Meta’s data window |
| Third-party (Hootsuite, Sprout Social, SocialPilot, etc.) | Long-term history, benchmarking, multi-account teams, automated exports | Paid, and adds a layer to learn |
If you’re managing several accounts or need reporting that goes back further than 90 days, a third-party platform pays for itself in clarity and saved time.
Conclusion
Instagram Insights turns every tap and swipe into a signal you can act on. Move past surface stats, learn the metrics that actually predict growth — views, reach, saves, and especially sends — and let the data guide what you create next. Review your top performers, test new formats and timings, and keep refining. Even a single insight, applied consistently, can be the thing that unlocks your next stage of growth.
FAQ
What’s the difference between views and reach on Instagram? Views count every time your content is seen, including repeat views from the same person. Reach counts only unique accounts. Because of that, views are always equal to or higher than reach — reach can never be the larger number.
What happened to impressions on Instagram? As of April 21, 2025, Instagram retired impressions (and Reel “plays”) and made Views the primary metric across all content types. If a guide or tool still centers on impressions, it’s pre-2025 information.
How often does Instagram update Insights data? Roughly once every 24 hours, so there can be up to a one-day lag before you see the full impact of a new post. For real-time monitoring, supplement with a third-party analytics tool.
How far back does Instagram Insights data go? Only 90 days — and Story metrics disappear after just 14. Export or screenshot your key numbers monthly if you want quarterly or year-over-year comparisons.
Why can’t I see Insights on my account? Almost always because the account is still set to personal. Switch to a Business or Creator account in your settings. Remember that data tracking only begins after you convert, so a brand-new professional account needs time to accumulate history.
What’s a good engagement rate on Instagram? A common benchmark is around 2–3%, though it varies widely by niche and account size. Rather than chasing a universal number, track your own rate over time and focus on improving sends and saves relative to reach.

Related Posts