Most businesses lose the majority of their potential customers not because their product is wrong or their price is off — but because something in their funnel creates unnecessary friction. A visitor who was ready to buy abandoned the checkout. A lead who downloaded your guide never opened the follow-up email. A prospect who visited your pricing page three times never requested a demo.
Funnel optimization is the disciplined process of identifying exactly where these losses happen, understanding why, and systematically fixing them. This guide focuses on the analytical and testing methods that make funnel optimization actually work — not just the general principles, but the specific techniques for finding bottlenecks, designing tests, and measuring real improvement.
What are the stages of the marketing funnel and why do they matter?
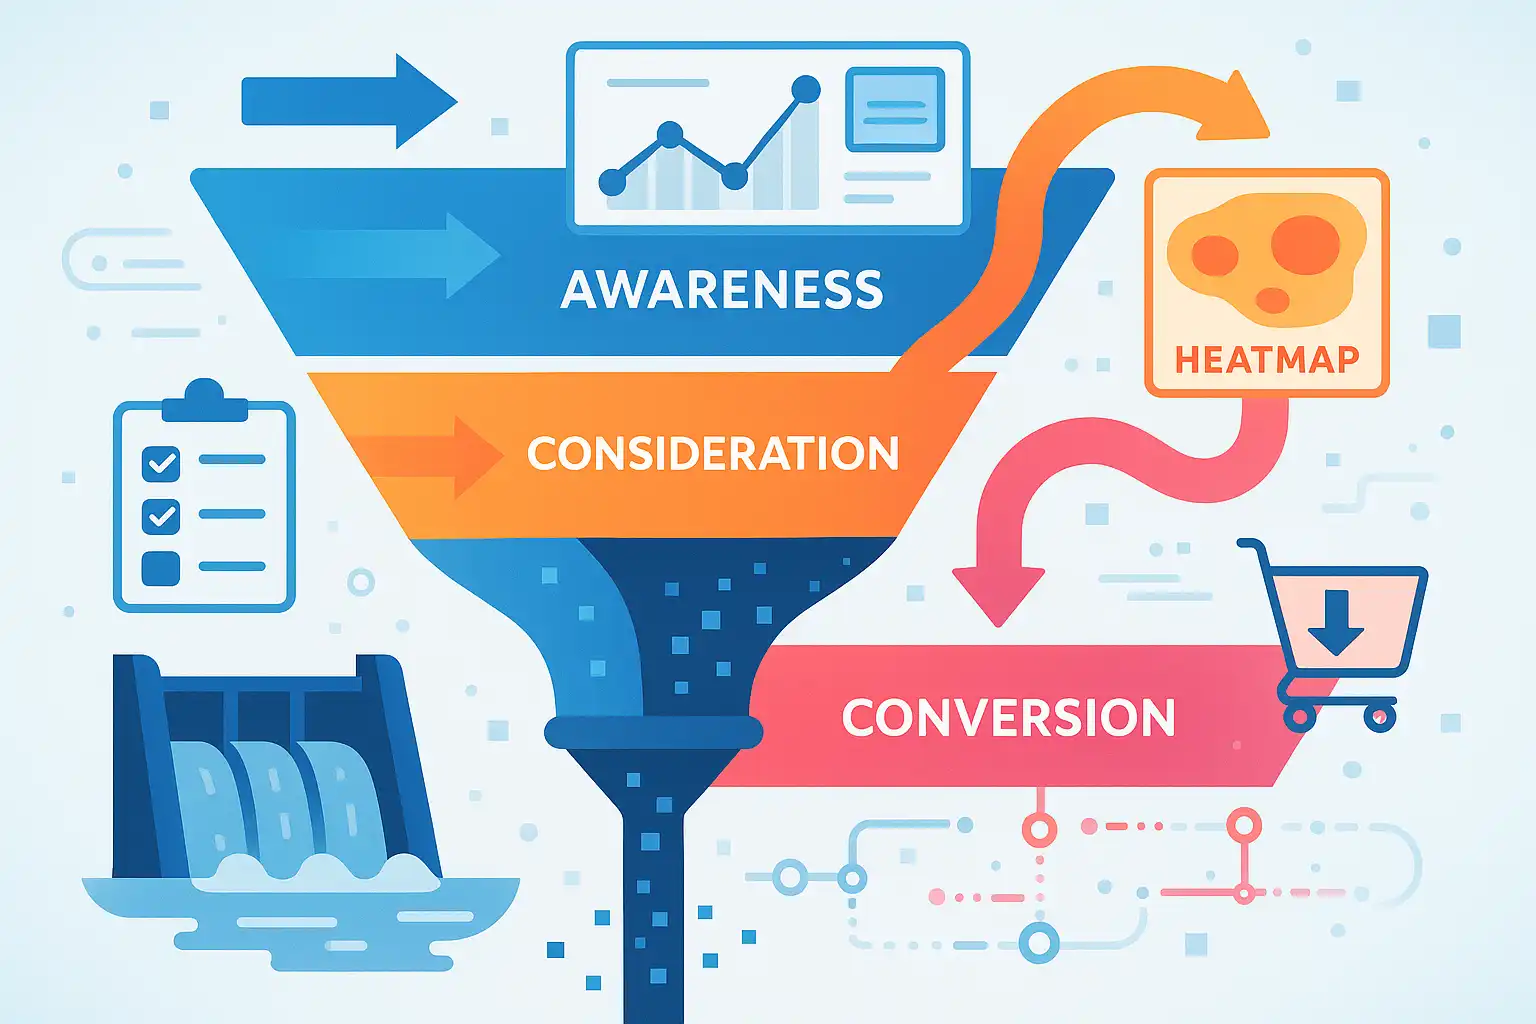
The marketing funnel is a model for understanding the steps people take before making a decision. It’s typically divided into three main stages:
- Awareness (Top of Funnel, TOFU): Prospects discover your brand or product for the first time.
- Consideration (Middle of Funnel, MOFU): Interested users seek more information, compare options, and weigh the benefits.
- Conversion (Bottom of Funnel, BOFU): Ready-to-buy visitors take action — making a purchase, signing up, or another key goal.
Each stage has its own challenges. Optimizing your funnel means tweaking each step so more people keep moving toward your goal rather than dropping off.
How to identify bottlenecks before you try to fix anything
The most common funnel optimization mistake is jumping to solutions before understanding the problem. Effective bottleneck identification requires three layers of data:
Layer 1: Quantitative funnel data (where are people dropping off?)
Start with a complete funnel map in your analytics tool. In Google Analytics 4, this means building a funnel exploration report that tracks users from first touch through each conversion step. For each transition between steps, calculate:
- Drop-off rate: What percentage of users fail to move to the next step?
- Time to drop-off: Do users drop immediately (messaging mismatch) or after a delay (friction or confusion)?
- Device segmentation: Is the drop-off rate significantly higher on mobile?
- Traffic source segmentation: Is the drop-off concentrated among users from a specific channel?
Where to look first: The step with the largest absolute drop-off in user volume — not the highest percentage drop-off rate — is usually your highest-priority optimization target.
Layer 2: Behavioral data (what are users doing on the page?)
Once you’ve identified which step is losing the most users, behavioral tools show you what’s actually happening. Hotjar and Microsoft Clarity provide heatmaps showing which elements receive the most attention (click maps, scroll maps), whether users scroll far enough to see your CTA, and which parts of the page are ignored entirely.
Session recordings show individual user journeys. Filter for sessions that ended at the bottleneck page and watch 10-15 of them. Look for rage clicks (rapid repeated clicking), U-turns (users scrolling down then back up), form abandonment points, and error states they encounter without resolving.
Layer 3: Qualitative data (why are users dropping off?)
Numbers tell you where. Users tell you why. On-page surveys at critical bottleneck points are one of the highest-ROI investments in funnel optimization.
Even 30-50 responses to an on-page survey typically reveal patterns that quantitative data alone wouldn’t surface. Example questions: “What’s stopping you from completing this step today?” (on high-exit pages) or “Is there anything about our pricing that’s unclear?” (on pricing pages).

A/B testing: how to design tests that produce real insight
A/B testing is the primary tool for validating funnel improvements — but most A/B tests are poorly designed and produce inconclusive results.
Designing tests that work
- Test one variable at a time. Changing multiple elements simultaneously tells you which combination wins, but not which change drove the improvement.
- Size your test correctly. Use a sample size calculator before starting. For most funnel tests, you need at least 1,000 visitors per variant — run tests until you reach 95% statistical confidence before drawing conclusions.
- Test the right elements first. In roughly this order: value proposition/headline → CTA copy → CTA placement → social proof type and placement → form length → pricing presentation.
- Document your hypothesis before testing. “We believe that [changing X] will [produce outcome Y] because [users currently experience Z].” This connects the test to specific insight from your data.
High-impact optimizations by funnel stage
Top of funnel: fix audience-message mismatch first
The most common TOFU bottleneck isn’t the landing page — it’s that the wrong people are arriving. Before redesigning pages, check whether your campaigns target the right audience and whether the ad/email/social message matches what the landing page says. Once traffic quality is confirmed, TOFU optimization focuses on faster load times, a clearer value proposition in the first viewport, and reduced cognitive load (fewer choices, cleaner design, single clear next step).
Middle of funnel: reduce objections before they form
MOFU bottlenecks usually mean users are interested but not yet convinced. Add social proof at decision points, surface the specific objections your sales team hears most often, add comparison content for buyers who are evaluating alternatives, and reduce commitment friction (“Start free trial” vs “Buy now” at this stage).
Bottom of funnel: remove every possible friction point
BOFU optimization is about removing barriers for people who have already decided. Show shipping costs and fees early, offer guest checkout, add progress indicators in multi-step flows, place trust signals near the conversion action, and enable form autofill.
For a more comprehensive look at how these tactics fit within a complete conversion strategy, this guide to funnel optimization strategies for conversions covers the full framework with stage-specific examples and measurement approaches.

Measuring optimization progress: metrics that matter
| Metric | What It Measures | Review Frequency |
|---|---|---|
| Funnel conversion rate (end-to-end) | Overall funnel health | Monthly |
| Stage-to-stage conversion rate | Which steps are improving or declining | Weekly |
| Cost per acquisition (CPA) | Efficiency of the entire funnel | Monthly |
| Average order value / deal size | Quality of conversions, not just volume | Monthly |
| Time to conversion | How long buyers take to decide | Quarterly |
For actionable tips on implementing quick improvements to these metrics, this collection of practical sales funnel optimization techniques covers high-impact changes that most teams can implement without major development resources.
Building a continuous optimization process
Funnel optimization isn’t a project — it’s an ongoing process. Build it into your team’s regular workflow:
- Weekly: Review key funnel metrics; flag any significant drops or improvements; check active A/B tests for statistical significance
- Monthly: Analyze bottlenecks across the full funnel; prioritize next optimization targets; review qualitative feedback from surveys and sales calls
- Quarterly: Audit your full funnel map for structural changes; assess whether your testing velocity is sufficient
The teams that see the greatest funnel improvement aren’t the ones who run the best individual tests — they’re the ones who run the most tests systematically, learn from each one, and compound those learnings over time. Connecting this optimization work to your broader content and marketing strategy ensures that each funnel improvement reinforces the rest of your customer acquisition system.
Funnel Optimisation: What to Know
Related Posts